Observability
Context
In the vision, DBaas comes with an SLA. To help you and the Ops Team understanding the behavior of the technical stack, we provide an observability Stack.
Use cases
- Check the availability of DBaas
- Understand the slowness during the querying period
- Ask for resources optimizations / capacity planning
What to do ?
To access to the dashboard, follow the steps:
- Grafana
https://grafana.k8saas-<CLUSTER_NAME>.dbaas.thalesdigital.io
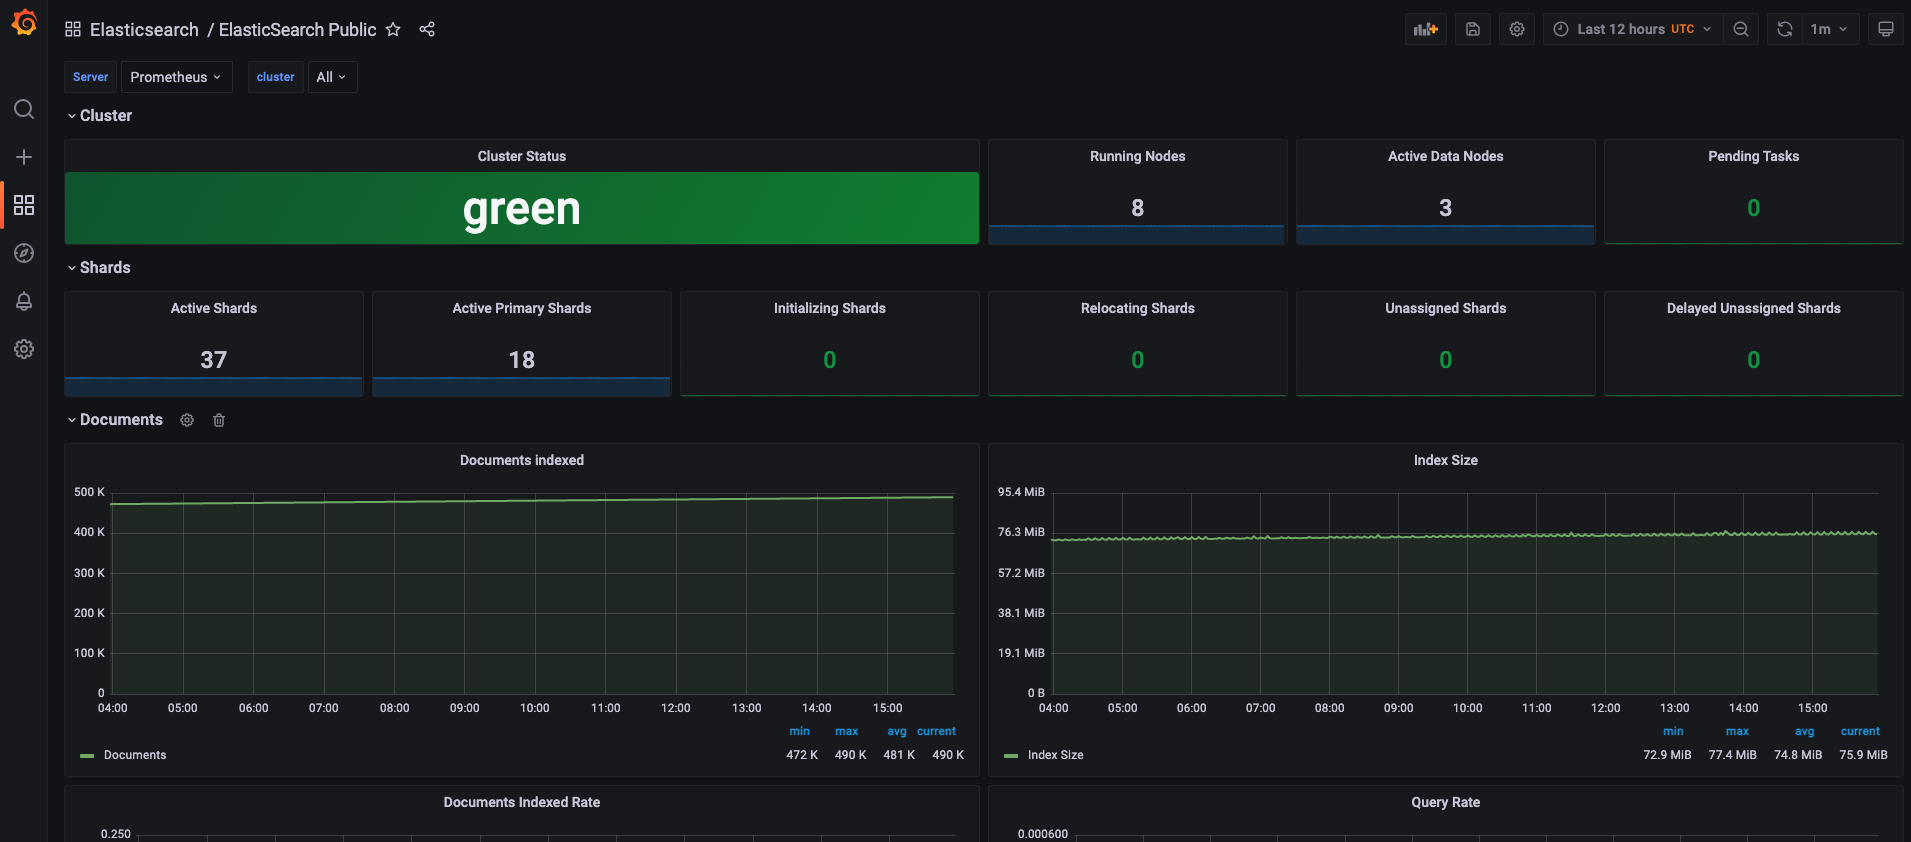
Then, you should see a dashboard like below.
Service Description
Alerting
ESaas integrates an alerting mechanism. These alerts are raised into our internal ticketing system to be analyzed by the OpS Team. Depending on the output of the analysis, the Ops can decide to alter the system, or contact you as a customer to perform some changes on your side.
What is monitored?
DBaas Postgresql
TBD
DBaas Cosmodb
TBD
DBaas opensearch
Cluster state
- Cluster status
- Number of running nodes (clients + data + masters)
- Number of active data nodes
Shards
- Active shards
- Active Primary Shards
- Initializing Shards
- Relocating Shards
- Unassigned Shards
- Delayed Unassigned Shards
Documents
- Documents Indexed
- Index size
- Documents Indexed Rate
- Query rate
- Query Count
System
- Total Memory
- Total Memory Free
- Total Moemory Available
- Thread Pools
- Thread pool rejections
- Avg. CPU Usage
- Avg Heap in 15min
- RX/TX Rate 5m
- GC seconds